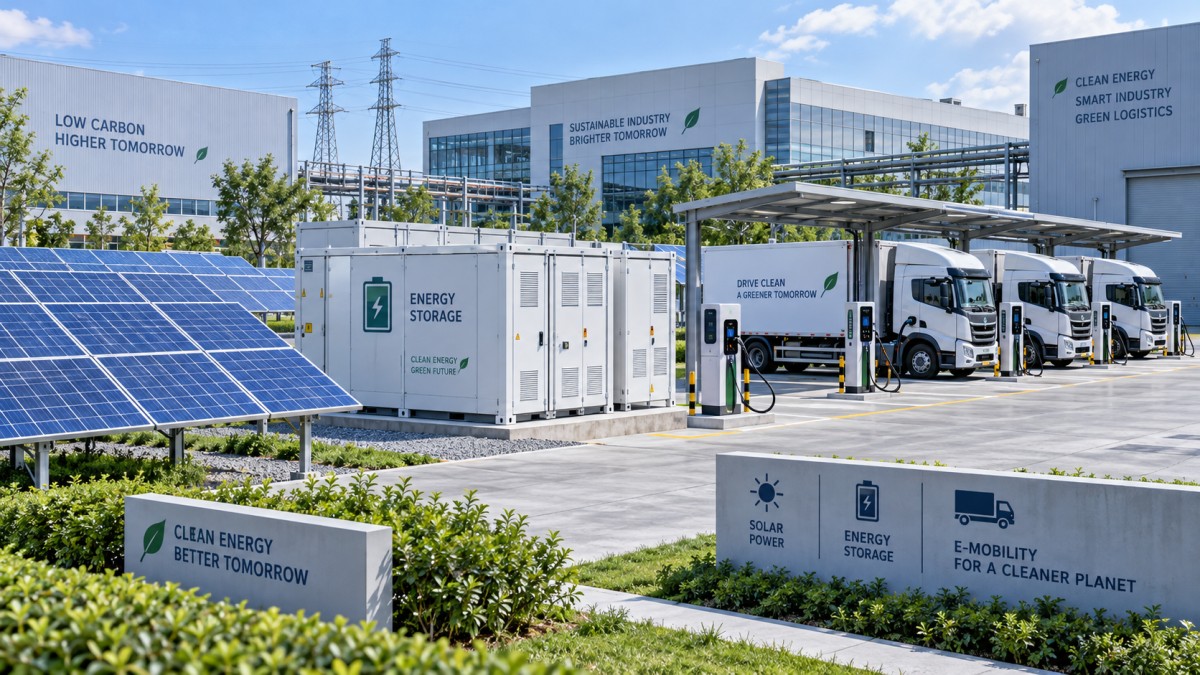
How Do You Compare Emissions Savings Across Energy Projects?
auth.Dr. Hideo TanakaTime
Oct 14, 2026Click Count
A project shortlist can make solar PV, battery storage, fleet electrification, and green hydrogen look directly comparable because every proposal reports “tonnes of carbon avoided.” They are not necessarily measuring the same thing. One may exclude manufacturing emissions, another may assume today’s grid remains unchanged, and a third may credit electricity that would otherwise have been curtailed. These differences can reverse the ranking and misdirect investment.
How should I compare emissions savings from competing energy projects? Calculate the difference between a credible no-project baseline and each project’s emissions using consistent boundaries, service requirements, and time horizons. Then report net annual savings, cumulative savings, and cost per tonne avoided separately. The strongest comparison makes assumptions visible rather than treating the largest headline reduction as the best investment.
Start with the service the investment must deliver
Before reviewing emissions claims, define the decision. Are the alternatives supplying electricity to a facility, moving goods, replacing industrial hydrogen, or reducing emissions across a capital portfolio? Projects providing different services can still compete for funding, but their equipment capacities are not equivalent measures of performance.
For alternatives that perform the same task, establish a common functional unit: electricity delivered at the connection point, vehicle-kilometres under a defined duty cycle, or hydrogen delivered at the required purity and pressure. Match reliability and operating requirements as well. Solar generation without firming is not the same service as dispatchable power available during a specified peak period.
For cross-sector portfolio decisions, retain those service-specific measures but compare absolute net tonnes of carbon dioxide equivalent, or tCO2e, over a common evaluation period. Add cost per tonne and delivery constraints. Do not compare a percentage reduction in vehicle emissions directly with a percentage reduction in electricity emissions; the underlying emissions volumes differ.
Build a baseline that would actually occur without the project
Avoided emissions are not an equipment characteristic. They depend on what the project replaces. A defensible baseline describes the likely continuation of operations without the proposed investment, including expected demand, asset replacement, and changes in electricity supply.
Use the same underlying assumptions across competing proposals where they apply. A PV project should not receive credit against an unusually carbon-intensive grid while an electrification project is assessed against a cleaner forecast for the same location and period. Different baselines are appropriate when the displaced activities genuinely differ, but those differences must be documented.
Check whether the project replaces existing demand or serves new demand. New EV charging capacity, for example, does not automatically demonstrate displaced combustion-vehicle travel. The assessment needs an explicit link between charging demand and the transport activity being substituted.
Set boundaries before calculating savings
The basic calculation is straightforward:
Net avoided emissions = baseline emissions − project emissions.
The difficult part is defining both terms consistently. An operational comparison includes fuel and electricity consumed during use. A lifecycle comparison also considers relevant manufacturing, construction, transport, maintenance, replacements, and end-of-life processes. Label the result clearly; operational savings should not be presented as lifecycle savings.
When different technologies compete for investment, lifecycle treatment helps prevent a project with substantial upfront emissions from appearing artificially favorable. Account for those emissions in the periods when they occur, then track the cumulative balance. Carbon payback is reached when accumulated operational savings exceed the additional upfront emissions relative to the baseline.
- Include replacement equipment: batteries, inverters, and other components may require replacement within the evaluation period.
- Use consistent greenhouse-gas treatment: document the global warming potential basis and include relevant non-CO2 gases rather than mixing CO2-only and CO2e figures.
- Keep lifecycle factors compatible: avoid counting upstream fuel or electricity emissions twice when they are already included in an emissions factor.
- Explain exclusions: identify omitted processes and assess whether they could materially affect the ranking.
Two analytical approaches also need separation. Attributional accounting allocates emissions to electricity or products consumed. Consequential analysis estimates how emissions change because of the investment. Both can be useful, but combining allocated electricity emissions for one proposal with estimated system-wide displacement for another creates an uneven comparison.

Choose electricity factors that match the question
Annual average grid factors can support an initial screening or an inventory calculation where the applicable method calls for them. They may be insufficient for projects whose value depends on operating hours. PV produces during daylight, batteries shift electricity between periods, and electrolyzers or vehicle chargers may adjust demand according to tariffs or control signals.
For a causal avoided-emissions assessment, examine the generation expected to respond to changes in demand or supply. Short-run marginal factors address changes in dispatch within the existing system. Long-run assessments consider how sustained investment or demand changes may influence generation capacity. Neither should be substituted silently for an annual average factor.
Where suitable data are available, calculate emissions using time-matched energy and emissions factors:
Operational electricity emissions = sum of electricity consumed in each interval × the applicable emissions factor for that interval.
Use a matching approach for displaced generation, with consistent units and geographic coverage. Account for network losses where relevant, and state whether energy is measured at generation, the site meter, or the final load.
Future grid conditions matter. Holding the present grid factor constant throughout a long project life can overstate savings where decarbonization is expected. Use transparent grid trajectories and test alternatives. Contractual renewable electricity claims should also be kept distinct from evidence of physical system-wide reductions; certificates or procurement arrangements alone do not establish what generation the project displaces.
Inspect the mechanisms behind each technology’s claim
Solar PV: generation must be usable and displace something
Base savings on delivered energy after conversion losses, downtime, degradation, and curtailment. Separate self-consumption from exports when their displacement assumptions differ. Electricity that would otherwise be curtailed should not automatically receive the same avoided-emissions credit as output replacing fossil generation.
Check whether an export limit or a weak connection constrains output during high-generation periods. A forecast based only on installed capacity can miss these restrictions and exaggerate both energy yield and carbon savings.
Storage: shifting energy is not inherently low-carbon
A battery consumes more electricity during charging than it returns during discharge. Its operational emissions benefit therefore depends on both charging emissions and the emissions displaced by discharge:
Storage operational savings = discharge energy × displaced emissions factor − charging energy × charging emissions factor − additional auxiliary emissions.
Metering boundaries matter: do not add auxiliary consumption again if it is already captured in charging measurements. Include lifecycle emissions separately. Storage may reduce emissions when charging is sufficiently low-carbon and discharge replaces higher-emission generation; it may increase emissions under the opposite operating pattern, even when it earns revenue.
EVs and hydrogen: compare equivalent delivered services
For fleet electrification, use actual route requirements, payload, seasonal efficiency, charging losses, and vehicle availability. Compare electricity consumption with the fuel use of a realistic alternative vehicle, not an outdated or poorly matched baseline. Include vehicle and battery production when making lifecycle claims.
For electrolytic hydrogen, evaluate electricity consumption alongside water treatment, compression, storage, and transport where relevant. Match the baseline product’s purity and delivery pressure. When hydrogen replaces another fuel, compare the useful output of the end-use process rather than assuming equal masses or energy inputs deliver identical performance.
Report scale, timing, and cost without conflating them
A project can have the largest lifetime reduction without offering the lowest cost per tonne. Another may reduce emissions sooner but deliver less total abatement. Preserve these distinctions in the decision table rather than compressing everything into one score.
- Annual net savings: show expected savings by year, particularly where output, utilization, or grid factors change.
- Cumulative net savings: subtract relevant upfront and replacement emissions over the common evaluation horizon.
- Service-level emissions intensity: show tCO2e per unit of delivered service to reveal efficiency differences.
- Carbon abatement cost: divide incremental net cost relative to the baseline by positive net tonnes avoided over the same horizon.
Incremental cost should include the applicable capital, operating, fuel, electricity, maintenance, and replacement differences, less genuine savings or revenues. State the discount rate and price assumptions. Financial costs are commonly discounted; any discounting or time-weighting of emissions should be declared rather than quietly applied.
A negative abatement cost indicates net financial savings under the stated assumptions, not automatically greater carbon savings. If net avoided emissions are zero or negative, cost per tonne avoided is not a meaningful positive-abatement metric. Report that outcome directly.
Use a common horizon for projects with different lifetimes and disclose any treatment of residual asset value. Do not extend one project’s carbon credit beyond the horizon while truncating another’s operation.
Test whether the ranking survives uncertainty
Start sensitivity testing with variables that can realistically change the decision: grid trajectory, utilization, displaced activity, storage dispatch, equipment life, degradation, and replacement frequency. Use plausible, documented ranges rather than unsupported precision.
A useful comparison includes a central estimate and clearly defined alternative cases. Apply shared uncertainties consistently: the same grid scenario should affect all projects connected to that grid. Keep project-specific uncertainties separate, such as fleet mileage or hydrogen offtake.
Look for switching conditions. If storage only reduces emissions when charging occurs below a particular emissions threshold, that condition should become an operating requirement. If a hydrogen project depends on high utilization to recover its upfront emissions, verify that the expected demand supports it. A ranking that changes under modest assumption shifts needs stronger evidence before commitment.
Turn the assessment into verifiable procurement requirements
Request underlying energy balances, operating profiles, emissions-factor sources, lifecycle boundaries, and baseline assumptions rather than accepting a single savings figure. Equipment safety or performance compliance does not, by itself, validate an avoided-emissions claim.
Require measurement points that correspond to the model: delivered PV energy, battery charging and discharging, charger input, vehicle activity, or hydrogen output and electricity consumption. Assign responsibility for maintaining the calculation as operating conditions change. The baseline remains a modeled counterfactual, even when project performance is measured.
Finally, prevent overlapping credits. PV and storage in one system should not each claim the full reduction from the same delivered electricity. Calculate the combined system against its baseline, then disclose any allocation between components. When claimed benefits cannot be reconciled to a common boundary and energy balance, the comparison is not ready to support an investment decision.
Recommended News
- 00
0000-00
Which energy storage stability metrics matter for frequency control?Explore energy storage stability metrics for frequency control, from response latency to sustained delivery. Learn what to measure and verify to compare systems with confidence. - 00
0000-00
How Do You Compare Emissions Savings Across Energy Projects?How should I compare emissions savings from competing energy projects? Learn to assess baselines, lifecycle impacts, and cost per tonne to make smarter investment decisions. - 00
0000-00
Can Grid Connection Delays Make a Renewable Energy Project Unviable?Could grid connection delays make a renewable energy project unviable? Discover financial risks, contract pitfalls, and mitigation options to protect returns and make smarter investment decisions.
000000-00
{item.title}{item.description}Search News
Industry Portal
Hot Articles
- Can AI solutions detect transformer faults before equipment fails?AI solutions can flag developing transformer faults before failure. Discover which warning signs matter, how to assess vendor claims, and what makes predictive maintenance actionable.
- How to tell whether health news is backed by reliable evidenceIs health news backed by reliable evidence? Learn to check sources, spot misleading claims, and understand real benefits and risks before making health decisions.
- Which health innovations help patients manage diabetes at home?Explore health innovations for managing diabetes at home, from glucose monitors to connected insulin pens. Compare benefits and daily demands to find tools that fit your care needs.
Popular Tags